Max O, an American economist, named the Lorenz Curve. It is a graphical representation used in economics to show the distribution of wealth or income within a population. Lorenz, who developed it in 1905. The curve plots the cumulative share of income or wealth held by each portion of the population, ranked by increasing share. In this article, we will discuss Understanding the Lorenz Curve With Examples, and the advantages and disadvantages of the Lorenz Curve.
Understanding the Lorenz Curve:
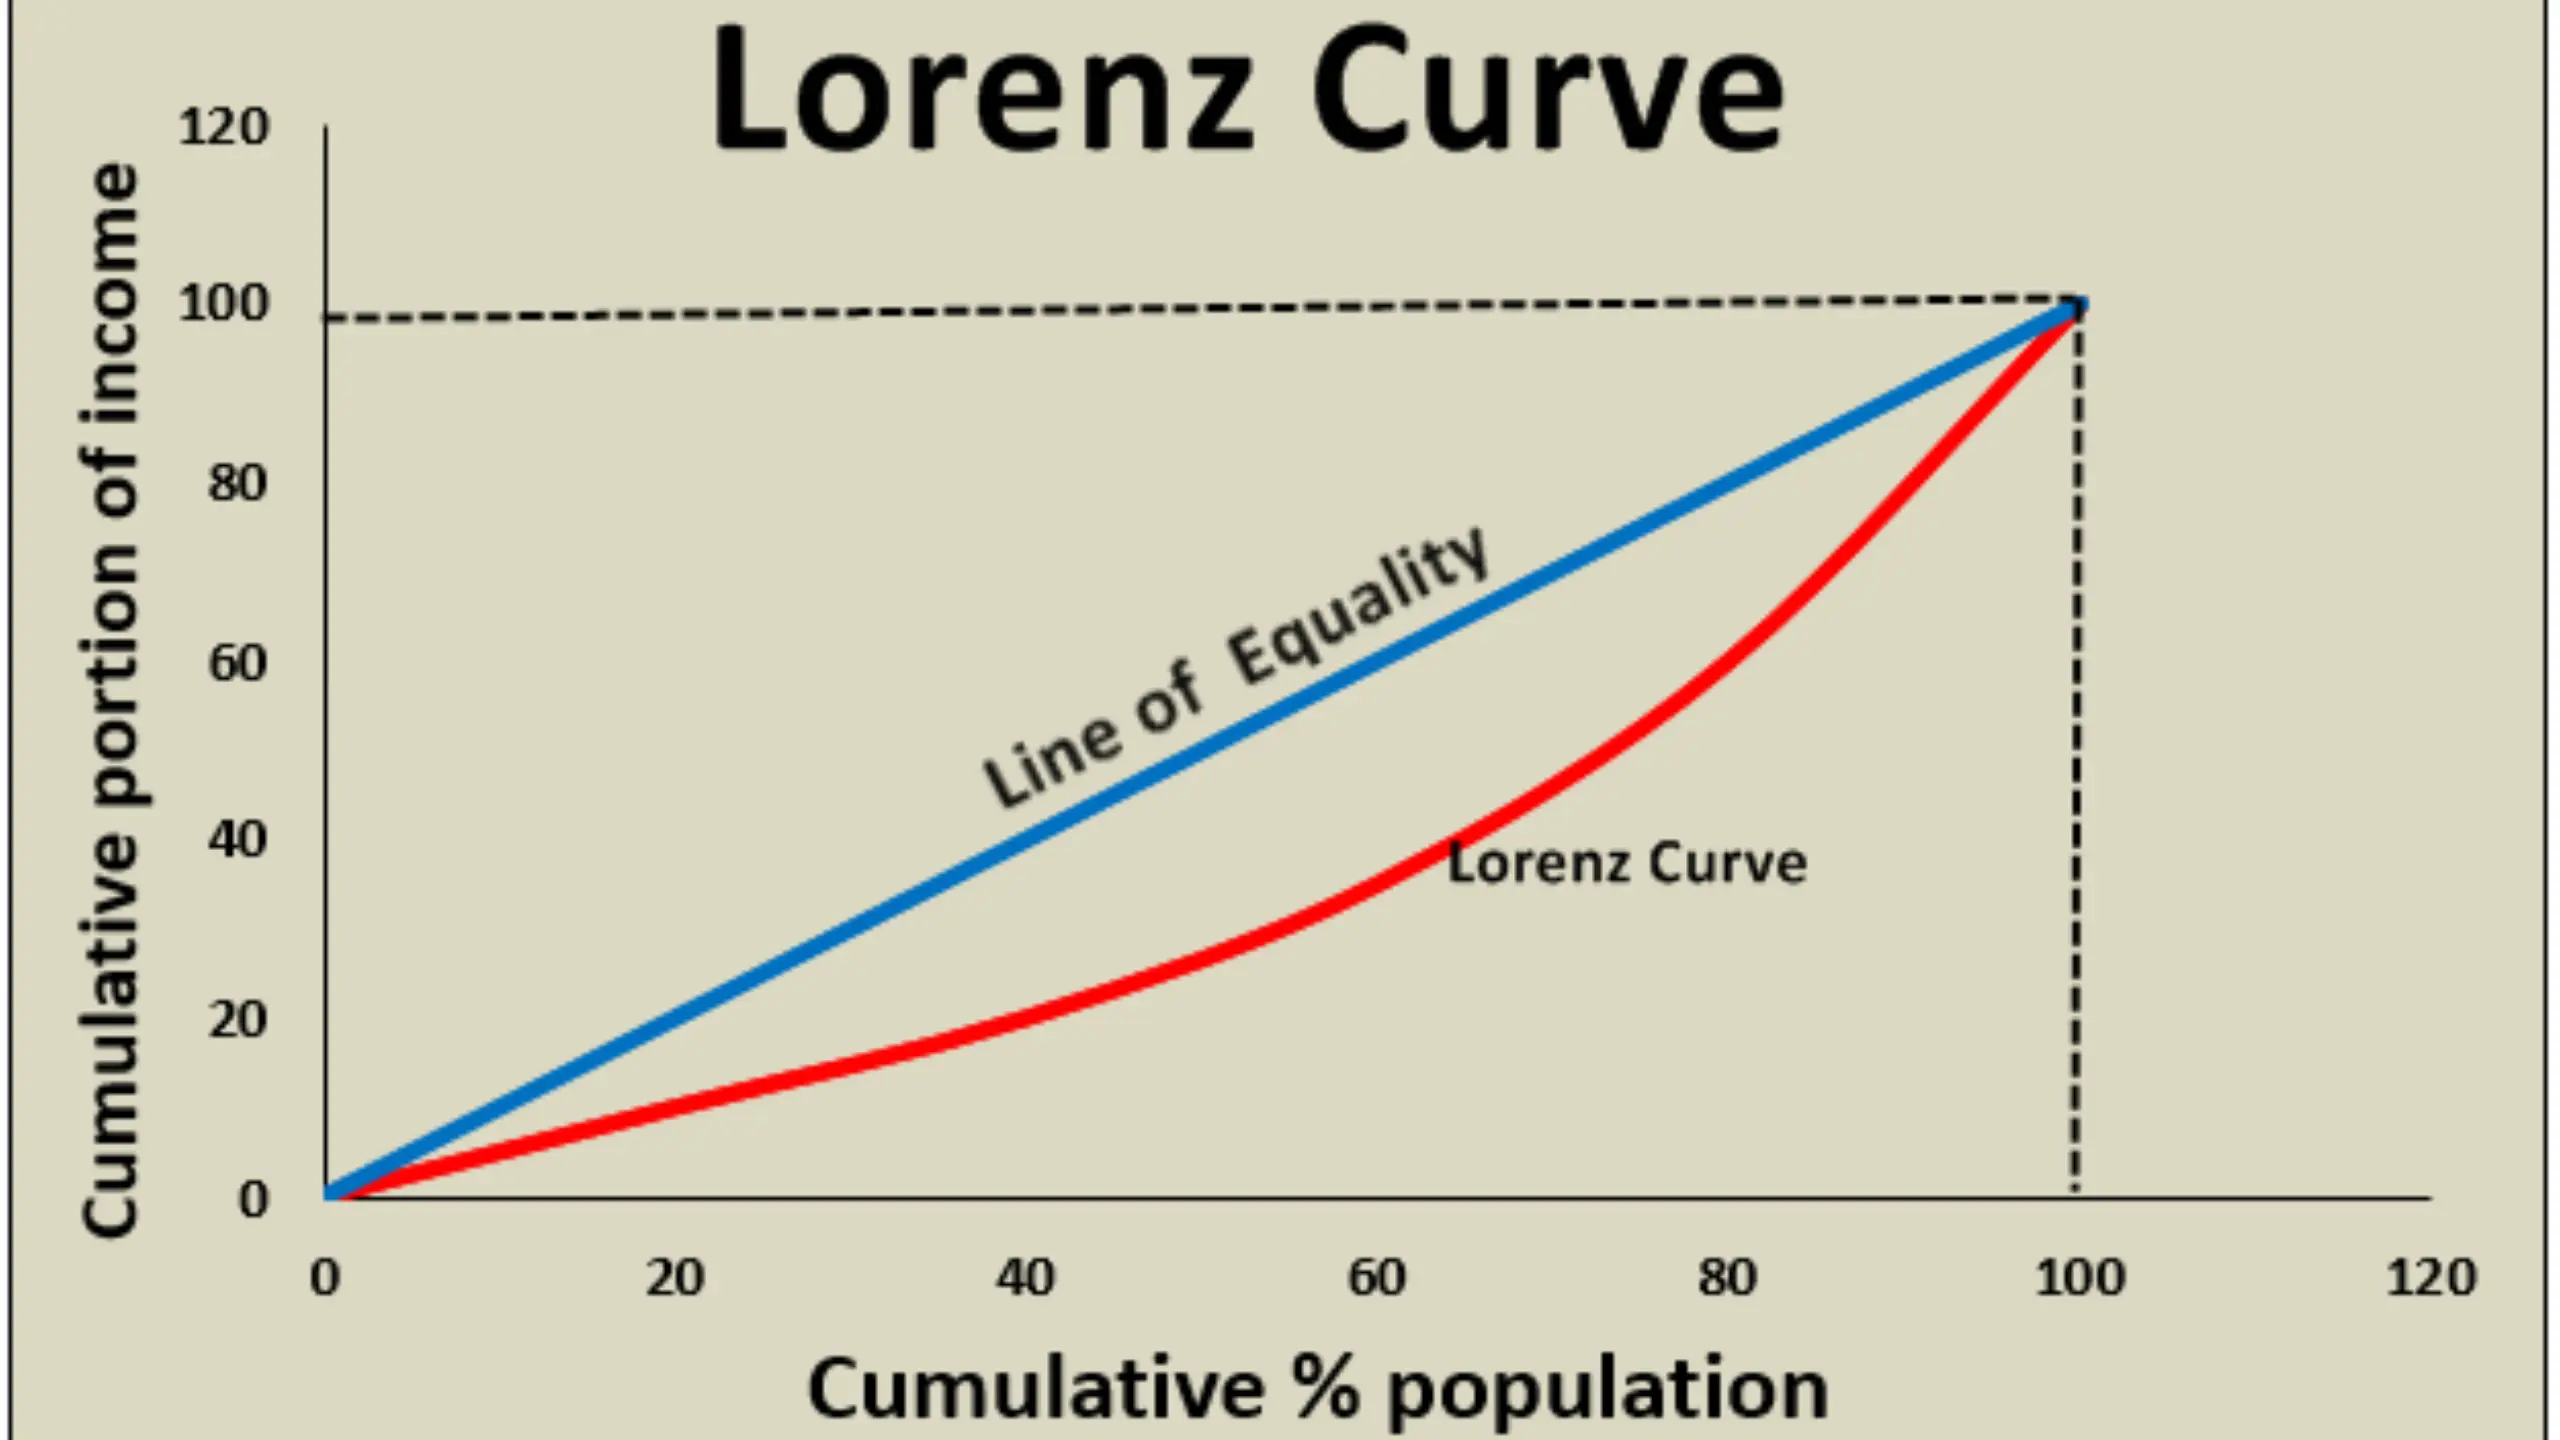
The Lorenz Curve enables different segments of a population to compare their share of a country’s income or wealth. It compares the actual distribution of income or wealth with an ideal scenario in which everyone has an equal share.
The Lorenz Curve commences at the bottom left corner of the graph, where the poorest individuals are situated. It then proceeds upward and to the right, reflecting the cumulative share of income or wealth held by each segment of the population. Finally, at the top-right corner of the graph, the point represents the richest individuals in the population. The diagonal line, on the other hand, represents a perfectly equal distribution of income or wealth.
Components of the Lorenz Curve:
The Lorenz Curve comprises two key components: the horizontal and vertical axis. Specifically, the horizontal axis arranges segments of the population by an increasing share of income or wealth, while the vertical axis represents the cumulative share of total income or wealth held by the population up to that point.
The Lorenz Curve and the Gini Coefficient:
The Gini coefficient is a numerical representation of income or wealth inequality and is closely related to the Lorenz curve. It ranges from 0 (perfect equality) to 1 (perfect inequality), with 0 representing equal income/wealth sharing and 1 denoting one person owning all income/wealth.
Advantages and Disadvantages of the Lorenz Curve:
The Lorenz Curve’s advantage is that it visually represents income or wealth distribution. Policymakers and economists interested in addressing income inequality find it helpful. Another benefit is comparing income or wealth distributions across different countries or periods.
However, one disadvantage of the Lorenz Curve is that it does not provide any information about the absolute levels of income or wealth held by different segments of the population. Lorenz Curve displays relative income/wealth distribution, excluding wealth differences among demographic groups such as gender and race.
Lorenz Curve Example:
Ranking the population from poorest to richest is necessary to plot income distribution using the Lorenz Curve for 100 people. Subsequently, we calculate the cumulative share of income for each segment of the population.
The poorest 20% have a cumulative income share of 5%, while the richest 20% have a cumulative income share of 95%.
The Lorenz Curve plots actual income distribution against an equal distribution represented by a diagonal line. The curve lies below the diagonal line, indicating greater income inequality in the actual distribution.
Summarize
The Lorenz Curve aids policymakers and economists in analyzing income or wealth distribution. However, it has limitations, including not providing absolute income or wealth levels and failing to account for demographic differences in wealth distribution. These limitations should be taken into account when interpreting Lorenz Curve results.


